Entropy in AFL Scoring (Revisited)

At the distinct risk of diving yet deeper into what was already a fairly esoteric topic, I'm going to return in this blog to the notion of entropy as it applies to VFL/AFL scoring, which I considered at some length in a previous blog. Consider yourself duly warned - this post is probably only for those of you who truly enjoyed that earlier blog.

Read More

Goalkicking Accuracy Across The Seasons

Last weekend's goal-kicking was strikingly poor, as I commented in the previous blog, and this led me to wonder about the trends in kicking accuracy across football history. Just about every sport I can think of has seen significant improvements in the techniques of those playing and this has generally led to improved performance. If that applies to football then we could reasonably expect to see higher levels of accuracy across time.
Read More

The Decline of the Humble Behind

Last year, you might recall, a spate of deliberately rushed behinds prompted the AFL to review and ultimately change the laws relating to this form of scoring.

Has the change led to a reduction in the number of behinds recorded in each game? The evidence is fairly strong:

Goals and Behinds.png

So far this season we've seen 22.3 behinds per game, which is 2.6 per game fewer than we saw in 2008 and puts us on track to record the lowest number of average behinds per game since 1915. Back then though goals came as much more of a surprise, so a spectator at an average game in 1915 could expect to witness only 16 goals to go along with the 22 behinds. Happy days.

This year's behind decline continues a trend during which the number of behinds per game has dropped from a high of 27.3 per game in 1991 to its current level, a full 5 behinds fewer, interrupted only by occasional upticks such as the 25.1 behinds per game recorded in 2007 and the 24.9 recorded in 2008.

While behind numbers have been falling recently, goals per game have also trended down - from 29.6 in 1991, to this season's current average of 26.8. Still, AFL followers can expect to witness more goals than behinds in most games they watch. This wasn't always the case. Not until the season of 1969 had there been a single season with more goals than behinds, and not until 1976 did such an outcome became a regular occurrence. In only one season since then, 1981, have fans endured more behinds than goals across the entire season.

On a game-by-game basis, 90 of 128 games this season, or a smidge over 70%, have produced more goals than behinds. Four more games have produced an equal number of each.

As a logical consequence of all these trends, behinds have had a significantly smaller impact on the result of games, as evidenced by the chart below which shows the percentage of scoring attributable to behinds falling from above 20% in the very early seasons to around 15% across the period 1930 to 1980, to this season's 12.2%, the second-lowest percentage of all time, surpassed only by the 11.9% of season 2000.

Behinds PC.png

(There are more statistical analyses of the AFL on MAFL Online's sister site at MAFL Stats.)

Winners' Share of Scoring

You might recall from seasons past my commenting on what I've claimed to be a startling regularity in AFL scoring, specifically, the proportion of scoring shots recorded by winning teams.

In 2008, winning teams racked up 57.3% of all scoring shots, while in 2007 the figure was 56.6%, and in 2006 it was 56.7%. Across the period 1999 to 2008 this percentage bounced around in a range between 56.4% and 57.8%. By any standard that's remarkable regularity.

I've recently come into possession of the scores for the entire history of the VFL/AFL competition in a readily analysable form - and by now you surely now how dangerous that's gotta be - so it seemed only natural to see if this regularity persisted into earlier seasons (assuming that it makes sense for something to persist into the past).

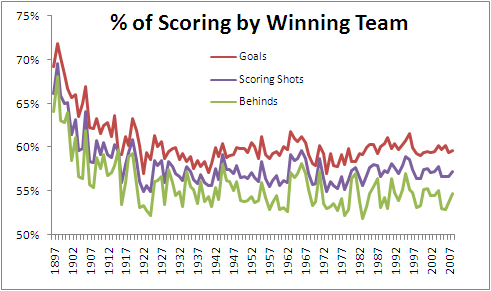
Below is a chart showing (in purple) the percentage of scoring shots registered by winning teams in each of the seasons 1897 through 2008. (The red line shows the proportion of goals that they scored, and the green line shows the proportion of behinds.)

Winners_Scoring.png

So, apart from the more extreme dominance of winning teams in the first decade or so of the competition, and a few other aberrant seasons over the next two decades, we have certainly seen remarkable stability in the percentage we've been discussing. Indeed, in the period 1927 to 2008, the percentage of scoring shots registered by winning teams has never been outside the range 55.0% to 59.6%. That surely almost establishes this phenomenon as a Law of Footy.

For those of you who prefer to digest your data in tabular form (preferably taken with meals), here's a decade-by-decade summary of the data.

Winners_Scoring_Table.png

The recent peak in winning teams' share of scoring was witnessed in 1995 and it came not as a consequence of a spike in 6-pointer dominance but instead from a spike in winning teams' share of behinds. In 1995 winning teams scored 57% of all behinds, which is about 2-4% higher than anything we've witnessed since. 1995 was the year that Carlton won the minor premiership kicking 317 behinds, Geelong finished runners-up kicking 338, and Richmond and Essendon, finishing in 3rd and 4th, kicked 600 more between them. By way of context, that's almost 75 more behinds than the top 4 of Geelong, Hawthorn, Western Bulldogs and St Kilda managed in 2008.

Regularity also aptly describes the history of the percentage of goals kicked by winning teams across the seasons (the red line in the chart). Again looking at the entire period since 1927, this percentage has never strayed from the righteous range of 57.0% to 61.8%.

Winning teams' share of behinds (the green line) has been, relatively speaking, quite variable, ranging from 51.9% to 58.2% in the period 1927 to the present, which once again demonstrates that it's goals and not behinds that win footy games.