Game Margins and the Generalised Tukey Lambda Distribution
/The Normal Distribution often turns up, like the Spanish Inquisition, in places where you've no a priori reason to expect it. For example, I've shown before that bookmaker handicap-adjusted margins appear to be distributed Normally.
For today's post I've again looked at adjusted home team game margins but, instead of adjusting the actual game margin by subtracting the bookmaker's published handicap, I've subtracted the predictions from regression models based on:
- The participating teams' MARS Ratings and the Interstate Status of the clash
- The Risk-Equalising Bookmaker Probability for the home team
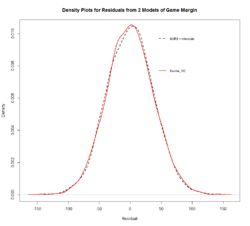
The "residuals" from these models, which were fitted to the data for all games from R1 of season 2000 to R19 of season 2013, certainly look Normally distributed.
Calculating the mean, variance, skewness and kurtosis of these residuals only reinforces this point of view.
For the residuals from the model using MARS Ratings and Interstate Status, we have:
Mean: 0.00 (this is mathematically enforced by the process of fitting an OLS regression)
Variance: 1,392.32 points squared
Skewness: 0.01
Kurtosis : 3.08
Now the skewness for a Normal Distribution is zero and the kurtosis is 3, so we're clearly dealing with something very Normal-like here.
We come to a similar conclusion if we use the residuals from the model using the Bookmaker's Risk-Equalising home team probability assessment as the sole regressor:
Mean : 0.00 (again a logical consequence of fitting a least-squares regression)
Variance : 1,393.67
Skewness : 0.04
Kurtosis : 3.03
So, the residuals from this model are slightly more skewed - and hence less Normal-like - than those from the previous model but have kurtosis that is slightly closer to that of a pure Normal distribution.
Both sets of residuals are, clearly, very close to Normally-distributed.
As an exercise, mostly because I'd never come across the Tukey Lambda Distribution or its generalised version before, I fitted a Generalised Tukey Lambda Distribution to the residuals from the model with MARS Ratings and Interstate Status as regressors, using the GLDEX package in R.
The Generalised Tukey Lambda Distribution has two parameterisations, one due to Ramberg & Schmeiser (RS), and the other to Freimer, Mudholkar, Kollia and Lin (FMKL). What's remarkable about this distribution, which is defined by just four parameters (canonically referred to as lambda 1 through 4), is that it can approximate the Normal, Uniform, Beta, Students-t, Exponential, Weibull, Gamma, Lognormal, Pareto, F, Chi-square, Logistic, Double Exponential and Extreme Value distributions, depending on the values that its quartet of lambdas take on.
Using maximum-likelihood estimation and the FMKL parameterisation we come up with a distribution that fits the residuals fairly well - certainly at least about as well as does a Normal with the same mean and variance as the actual residuals.
The fitted Generalised Tukey Lambda Distribution has a mean of 0, a variance of 1,395.99 points squared, a skewness of 0.01, and a kurtosis of 3.07.
Those values, as do those of the underlying actual residuals themselves, scream 'Normal'.
Clearly then, the extent to which the final margin of an actual AFL game diverges from its expected value, that value being based on the relative skills of the participating teams and on the Interstate Status of the clash in question, appears to follow a Normal distribution with zero mean and a variance of about 1,400 points squared (ie a standard deviation of about 37 points).
The enduring question for me is: why?
But, that's a topic for some future blogs ...


